Systematic Trading (July 2022): Bank of America & Unilever
Welcome to the tenth part of our series on Systematic Trading!
In this part, you’ll discover two stocks that are performing poorly in the US stock market. Furthermore, these stocks are exciting as they look like they are about to break down and hit new lows.
Before you scroll further, you’ll want to check out our stock pick in June on Darling Ingredients & Dow Inc.
Are you excited and ready to jump in?
Bank of America (NYSE: BAC)
![]()
Source: bankofamerica.com
1. About The Company
Bank of America is one storied bank. It was founded way back in 1784, more than 200 years ago!
Today, it’s the largest bank in the world based on market capitalization. Its market capitalization stands at more than $258b.
What does Bank of America provide as the largest bank in the world?
Bank of America serves a wide spectrum of clients, ranging from individuals to mega corporations, and even governments worldwide.
It offers traditional savings accounts, certificates of deposit, checking accounts, investment products and management, financing, wealth management solutions, market making and more.
With an extremely wide range of products and services, Bank of America has managed to attract and acquire about 41m active users.
Knowing the size of the bank and the services it provides, what does the chart of Bank of America look like? Is it ready for a position trade?
Let’s take a look at its chart in the next section.
2. Position Trading (Daily)
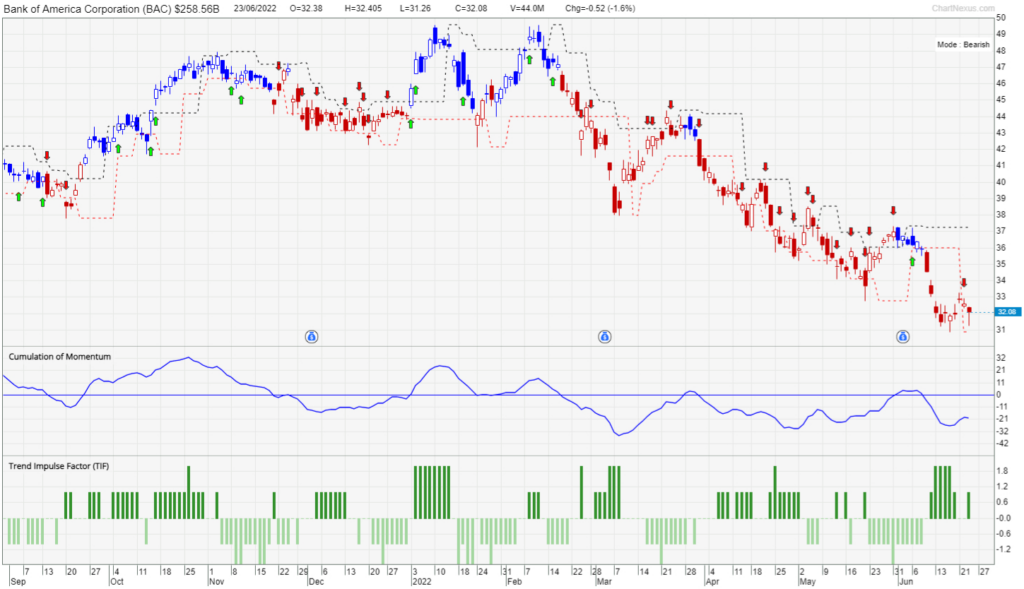
Referring to the chart above, you’ll easily notice that the price of Bank of America was in an uptrend till Nov 2021 before going sideways till Mar 2022.
Since Mar 2022, the price of Bank of America has been on a clear downtrend.
This downtrend is strong. New lows are created every month since Mar 2022 and this pattern doesn’t seem to be halting.
Does this make the shares of Bank of America an excellent target for short-selling?
Yes and no.
Yes, shares of Bank of America is an excellent stock to short-sell because its downtrend is strong and intact. In fact, the entire finance sector is in a strong downtrend, further bringing the odds to your side.
No, because there’s no agreement between the red arrow and Trend Impulse Factor indicator.
The red arrow must appear with a dark green bar of the Trend Impulse Factor indicator to serve as a confirmation. That’ll signal that the bearish momentum is strong and here to stay. Such a condition will be more favorable for a short position trade.
What should you do then?
You should patiently wait for both indicators to appear and agree with each other before taking a short position on Bank of America.
Unilever (NYSE: UL)
![]()
Source: unilever.com
1. About The Company
Founded in 1894, Unilever is 128 years old. Not many companies have such a long history.
Unilever is a conglomerate which has businesses in the beauty and wellness, personal hygiene, cleaning, and food and beverage industries! Popular brands under its care include Ben & Jerry’s, Cif, Dove, Lifebuoy, Rexona, and Vaseline among others.
Under good and tenacious management, Unilever has a presence in close to 200 countries. They are in nearly every country in the world!
Having such a global presence, it’s no wonder that it’s the world’s 103th most valuable company in the world with a market capitalization of more than $113b.
How is its stock faring?
Let’s find out!
2. Position Trading (Daily)
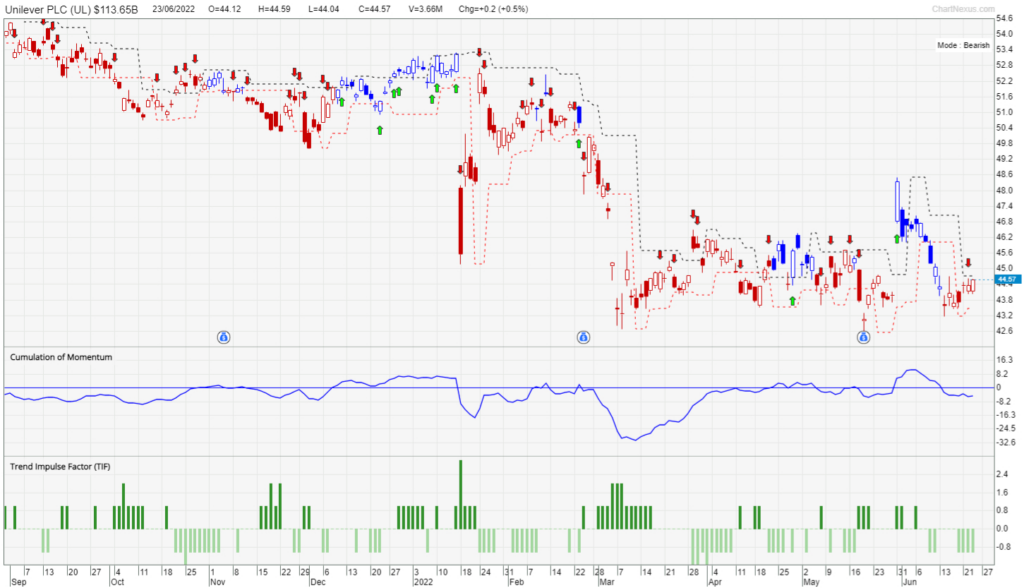
The price chart of Unilever is in a clear downtrend. There are many more red candles than blue.
Paying attention to the price action of Unilever from Mar 2022, you can see that its price has been stuck in a sideways movement. With the exception of a false breakout in late May 2022, its share price has been ranging between $42.50 to $46.50.
The next question to ask is – how probable is it for the share price of Unilever to break lower?
If the S&P 500 continues to slide, the probability of Unilever’s share price breaking lower and forming a new low is high.
And when that scenario occurs, what would you want to see before taking action to short the shares of Unilever?
Yes! You’ll want to see a red arrow accompanied by a dark green bar of the Trend Impulse Factor. When both indicators show, they confirm that the bearish momentum is present and most probably here to stay for a prolonged period of time.
Conclusion: Bank of America & Unilever
Both BAC and UNI are weak stocks. They are in a downtrend and the overall stock market sentiment is bearish.
Given that the appearance of the red arrow and dark green bar of the Trend Impulse Factor bar for both stocks have yet to appear together, it pays to be patient.
Furthermore, the overall US stock market may experience a dead cat bounce before the downtrend continues. This is another sign for us to continue waiting.
Because the stock market doesn’t behave according to our instructions and hopes, it’s advisable to place a stop loss level to protect your trading capital when the time to short both stocks are ripe, should an unexpected event occur.
Trading stocks without a proper system can be highly risky. This is why TradersGPS (TGPS) was created. The indicators will help you decipher if a stock is ready for action to be taken. You won’t have to feel in the dark and make wild guesses.
What are your thoughts? Which stock would you short-sell?
Share your thoughts with us below!
Did You Know?
The ones who make the MOST money from the stock market actually spent the LEAST time.
Yet, most people tend to spend hours reading news or analyzing charts, only to be caught in a never-ending spiral of disappointment from the stock market.
The truth is, profiting from the market is all about trading smart, not hard. And this is the very secret of all top retail traders and investors.
They all have a system they follow.
A system that helps them identify winning stocks fast and filter away dangerous risky ones, a system that tells them exactly when to buy and sell and eventually exit the stock with profits.
It’s like having a personal guide telling you exactly what to do from start to finish. One that is not only reliable in aiding your investment journey, but also saves you time, energy and stress.
So if you wish to start building an additional stream of income through the stock market the SMART way, not the HARD way…
Come and join me in my upcoming LIVE demonstration webclass where I will demonstrate LIVE how ANYONE, even with no experience can learn and adopt a really simple system and apply it almost immediately to start profiting in the markets.
Click HERE to register your seat before we hit full capacity!
If you’d also like to get a FREE e-course and learn how to better time your trade entries, click the banner below: