The debate about whether technical analysis actually works has been around for decades. “Works” meaning enabling users to be profitable traders. There are many passionate supporters on both sides of the fence. If you’re sitting on the fence on technical analysis, maybe this article will tip you to one side.
This is very similar to religious faith, you have people with such varied beliefs. And all of them are going to tell you their religion is the “right” one.
That argument has been going on for literally centuries without resolution.
So let’s not set technical analysis down that meaningless path.
Let me just state I am firmly in the “Works” camp, but instead of going into an irresolvable debate on whether technical analysis actually works, I would like to delve into the possibilities on HOW it works.
Famed trading psychologist, Van Tharp, really nailed it when he said, “You don’t trade the market, you trade your beliefs about the market”.
So find what you believe in the markets.
Technical analysis to me, means the observation of historical price movement on a chart, to assist in providing a directional bias and identifying opportunities to enter or exit the market at the best profit possible.
(If you are not familiar with the basic assumptions of technical analysis, check it out here:
3 things you absolutely must know about Technical Analysis!)
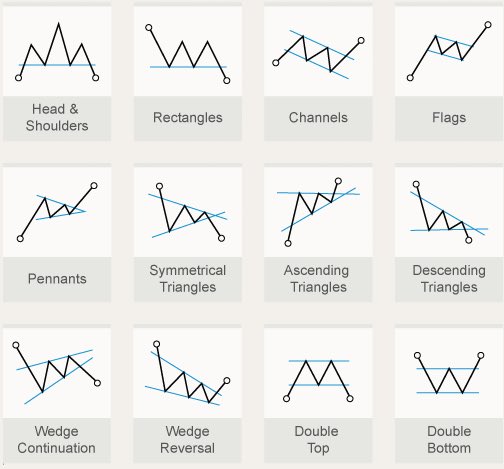
1) Do chart patterns represent something else?
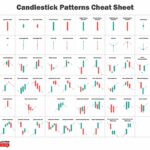
Let’s start with the basics, chart patterns. No fancy technical indicators, just what patterns are drawn by price.
Head and shoulders, cup and handle, double tops, triple tops and the list goes on.
What do you notice about all chart patterns?
They are formed by a sequence of highs and lows. Some highs are higher than previous highs, some are lower.
Based on the simple logic that if buyers feel that the price of a market is undervalued, they will continue to buy at higher and higher prices until the market is “correctly” valued. Sounds like this has its roots in fundamental analysis doesn’t it?
So a lower high can be an indication of weakening bulls in the market.
Hence why bearish patterns tend to have a lower high(weakening bulls) or a lower low(strengthening bears).
These patterns are simply a way to represent how we can view the sentiment in the market to derive a directional bias, but I don’t find them to be very useful for determining exact trade entries and exits.
2) Price reactions in relation to technical indicators
This is an interesting one.
When the RSI goes to overbought, do you notice price falling off a lot of the time? Or if MACD turns bullish, does the market really head higher? Or have you noticed how price tends to react around moving averages as dynamic support/resistance?
But do you also notice that all indicators tend to have periods where they work better in?
Price movements tend to have largely 2 types of phases, ranging and trending.
Oscillating indicators will appear to work really well in ranging markets.
The others like momentum or trend indicators, will work better in trending markets.
These indicators are also all derivatives of price. And they aim to build some context around historical prices so as to provide either current status and potential “next move”.
I do not discount the validity of indicators, but I always recommend using them in conjunction with an additional layer of technical analysis. Such as combining a chart pattern with the technical indicator readings.
(To gain more insight into technical indicators, check out this post:
Indicators Are NOT Useless. These Are The Perspectives They Offer Us.)
3) Self-fulfilling prophecy
The internet is probably one of the main reasons why this plays a factor in our markets now.
There is a lot of literature about this theory online as well.
With information so easily and widely available to nearly every trader on earth, it’s conceivable that a vast number of people could see the same technical signal and buy or sell at the same time.
This could create a significant measure of buying and selling which could push prices.
So which of these possibilities do you believe in?
I hope this sets you on your way to finding what you believe in the markets.
Research well folks!