Evaluating a company’s management is just as important as analysing its financials or stock performance. Strong leadership directly impacts a firm’s success, while poor decisions can quickly erode value. Here’s.
Read Full Article


I’ve known Collin through a mutual friend at church for a couple of years now. We’ve worked on numerous projects in the financial and investor education industry in Singapore.
He has always been genuine and generous with his ideas. His humility has made him a great and trustable person.

Chris Isaiah
Executive Director, Pioneers & Leaders Pte Ltd
Collin is very knowledgeable and experienced in stocks and shares.
I recommend Collin if you are planning to grow your portfolio and want someone to advise you.

Moonshi Mohsenruddin
CEO, Commgate (S) Pte Ltd
Collin Seow is probably the best trading guy I know in town, not just for his knowledge in the equity markets, but also for his heart for his clients!
I will only work with a person with a good heart, and Collin is definitely one!

Tea Eng Peng
ChFC Financial Advisory Director, Tea Eng Peng & Associates
I had attended some previews but never find one like Collin who is very approachable and helpful. He is very unassuming and would help you with your queries unlike others who are very aloof..Thumbs up!

Koo Tuck Seng
I’ve known Collin through a mutual friend at church for a couple of years now. We’ve worked on numerous projects in the financial and investor education industry in Singapore.
He has always been genuine and generous with his ideas. His humility has made him a great and trustable person.
Chris Isaiah
Executive Director, Pioneers & Leaders Pte Ltd
Collin is very knowledgeable and experienced in stocks and shares.
I recommend Collin if you are planning to grow your portfolio and want someone to advise you.
Moonshi Mohsenruddin
CEO, Commgate (S) Pte Ltd
His enthusiasm to empower investors without any overt bias is refreshing and very helpful.
I believe Collin’s enthusiasm on investor empowerment puts him in good stead to serve anyone who works with him.

Simeon Ang
Equity Analyst, Maybank Kim Eng
Collin Seow is probably the best trading guy I know in town, not just for his knowledge in the equity markets, but also for his heart for his clients!
I will only work with a person with a good heart, and Collin is definitely one!
Tea Eng Peng
ChFC Financial Advisory Director, Tea Eng Peng & Associates
I had attended some previews but never find one like Collin who is very approachable and helpful. He is very unassuming and would help you with your queries unlike others who are very aloof..Thumbs up!
Koo Tuck Seng
I’ve known Collin through a mutual friend at church for a couple of years now. We’ve worked on numerous projects in the financial and investor education industry in Singapore.
He has always been genuine and generous with his ideas. His humility has made him a great and trustable person.
Chris Isaiah
Executive Director, Pioneers & Leaders Pte Ltd
Collin is very knowledgeable and experienced in stocks and shares.
I recommend Collin if you are planning to grow your portfolio and want someone to advise you.
Moonshi Mohsenruddin
CEO, Commgate (S) Pte Ltd
His enthusiasm to empower investors without any overt bias is refreshing and very helpful.
I believe Collin’s enthusiasm on investor empowerment puts him in good stead to serve anyone who works with him.
Simeon Ang
Equity Analyst, Maybank Kim Eng
Collin Seow is probably the best trading guy I know in town, not just for his knowledge in the equity markets, but also for his heart for his clients!
I will only work with a person with a good heart, and Collin is definitely one!
Tea Eng Peng
ChFC Financial Advisory Director, Tea Eng Peng & Associates
I had attended some previews but never find one like Collin who is very approachable and helpful. He is very unassuming and would help you with your queries unlike others who are very aloof..Thumbs up!
Koo Tuck Seng

Evaluating a company’s management is just as important as analysing its financials or stock performance. Strong leadership directly impacts a firm’s success, while poor decisions can quickly erode value. Here’s.
Read Full Article
This article is for education purposes only, and not to be taken as advice to buy/sell. Please do your own due diligence before committing to any trade/investment. In the blink.
Read Full Article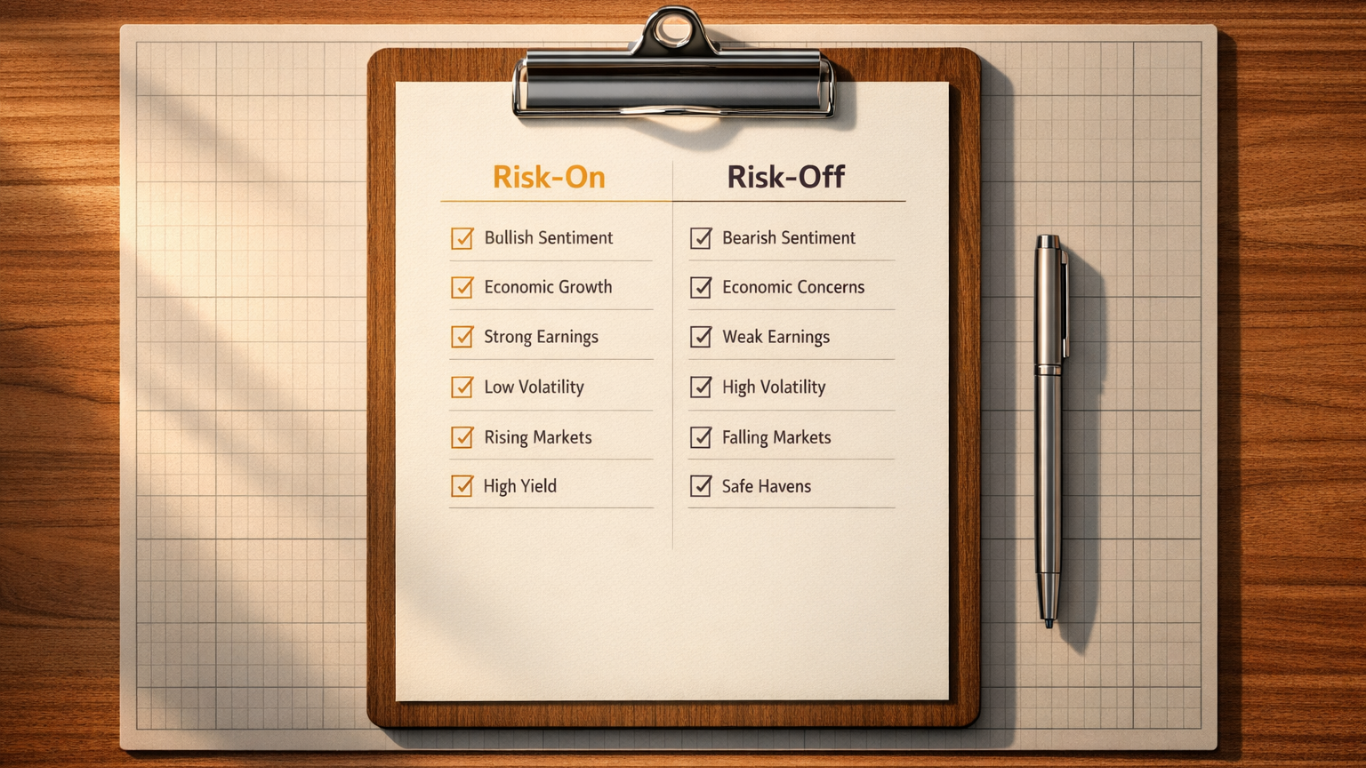
When trading, recognising whether the market is risk-on or risk-off is critical. Risk-on markets favour growth assets like equities and high-yield currencies (e.g., AUD, NZD), while risk-off markets push investors.
Read Full Article