
Trading Education
Top 5 Momentum Indicators for Trending Markets
Ever wondered how to time your trades in a trending market? Momentum indicators can help you identify the strength and speed of a trend, giving
Ever wondered how to time your trades in a trending market? Momentum indicators can help you identify the strength and speed of a trend, giving
About the Security (HKEX: 700) Tencent Holdings is a world-leading internet and technology company that develops innovative products and services, including video games, cloud computing,

About the Security (NASDAQ: AAXJ) iShares MSCI All Country Asia ex-Japan ETF seeks to track the investment results of an index composed of Asian equities,
About the Security (NASDAQ: INTC) Intel Corporation is an American multinational technology company headquartered in Santa Clara, California. Intel designs, manufactures, and sells computer components
About the Security (NASDAQ: CSCO) Cisco Systems, Inc is an American multinational digital communications technology company headquartered in San Jose, California. Cisco develops, manufactures, and

About the Stock (NYSE: NUE) Nucor Corporation is a major American steel and steel products manufacturer, also recognized as the largest recycler in North America.
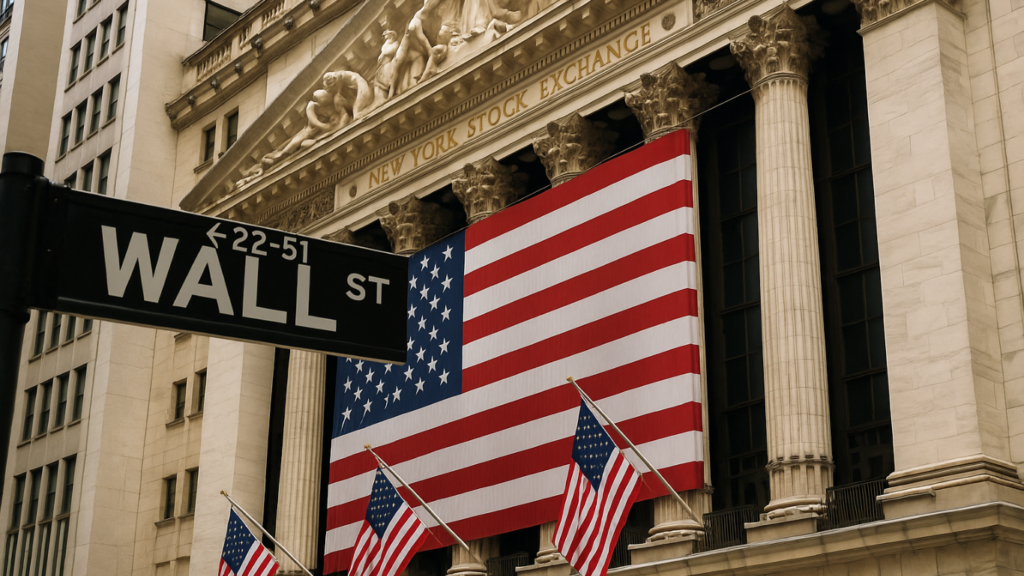
The sharp rebound in risk sentiment has pushed the S&P 500 index close to its record high, and chances are that the index could scale

Geopolitical Relief Drives Market Rebound Equity markets cheered the US-Iran agreement for a two-week ceasefire in Asia on Wednesday morning. US President Donald Trump agreed
Geopolitical Developments and Oil Price Reaction US equities rebounded after President Donald Trump said the US and Iran have held talks to end the hostilities
About the Security (NASDAQ: MRNA) Moderna, Inc. is an American pharmaceutical and biotechnology company based in Cambridge, Massachusetts, that focuses on RNA therapeutics, primarily Messenger